Ken Pomeroy does a log5 analysis prior to each conference’s tournament. For those unfamiliar with what log5 is, here’s a quick and dirty explanation. log5 is a formula that was created by famed baseball writer and statistician Bill James. James’ formula uses team A’s winning percentage and team B’s winning percentage to come up with the probability that team A wins. Kenpom’s version uses his Pythagorean Rating in place of winning perentage. I’ll give you the precise formula and an example at the end of the article for those truly interested in that stuff.
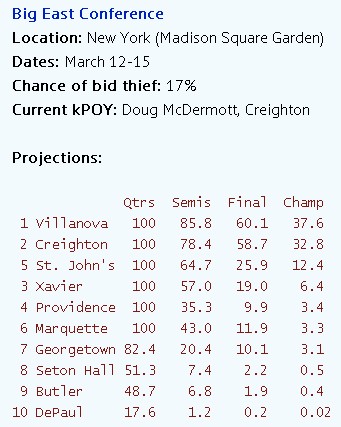
Here is Kenpom’s log5 for the Big East Tournament:
Continue reading Kenpom’s Big East Tournament log5 Prediction →
NCAA Tournament log5
Seed Team Rd32 Swt16 Elite8 Final4 Final Champ 1 in…
1W
Arizona
95.8
70.8
55.5
40.2
24.9
15.9
6
1S
Florida
95.7
71.6
51.2
35.7
22.6
12.9
8
4MW
Louisville
87.3
71.5
44.3
31.5
19.7
12.3
8
1E
Virginia
96.7
77.4
52.9
35.4
21.2
11.5
9
1MW
Wichita St.
95.4
68.1
36.8
24.4
13.9
8
13
2E
Villanova
92.3
62.3
41.3
21
10.8
5
20
3W
Creighton
87
59.1
36.1
16.6
7.6
3.6
27
2S
Kansas
88.2
58.1
34.5
16.1
8
3.5
29
3MW
Duke
84.6
53.5
33.2
14.1
6.8
3.2
31
4E
Michigan St.
84.3
51.4
22.9
12.5
5.9
2.4
41
2W
Wisconsin
82.2
53.3
29
12.4
5.3
2.3
43
2MW
Michigan
91.3
60.9
31.2
11.7
5
2.1
47
3S
Syracuse
83.6
48.4
25.2
10.5
4.7
1.8
55
5S
VCU
73
42.5
16.8
8.9
4.1
1.6
62
4S
UCLA
73.4
39.7
15
7.6
3.3
1.3
79
6S
Ohio St.
66.7
35.5
17.6
7
3
1.1
93
3E
Iowa St.
73.2
41.2
18.6
7.4
3
1
96
4W
San Diego St.
72.6
43.7
14.5
7
2.6
1
97
9S
Pittsburgh
71.5
23
11.9
5.9
2.5
0.9
108
11MW
Tennessee
40.9
20.8
11.9
4.5
2
0.9
117
8MW
Kentucky
64.9
23.1
8.9
4.4
1.8
0.7
139
7E
Connecticut
63.2
25.7
13.7
5.3
2
0.7
145
6E
North Carolina
59.4
32
13.6
5.1
1.9
0.6
157
5E
Cincinnati
56.3
26.8
9.9
4.6
1.8
0.6
162
8W
Gonzaga
50.6
14.7
8.4
4.1
1.6
0.6
163
9W
Oklahoma St.
49.4
14.1
8
3.9
1.4
0.6
178
7S
New Mexico
56.9
24
11.1
3.8
1.4
0.5
222
5W
Oklahoma
63.3
32.3
9.3
4
1.3
0.4
223
7W
Oregon
60
27.2
11.8
3.9
1.3
0.4
233
6W
Baylor
58.9
24
11.2
3.7
1.2
0.4
253
12E
Harvard
43.7
18.3
5.8
2.4
0.8
0.2
438
11MW
Iowa
26.2
11.3
5.6
1.7
0.6
0.2
451
5MW
Saint Louis
57.1
14.4
4.3
1.7
0.5
0.2
638
7MW
Texas
52.3
20.2
7.2
1.8
0.5
0.1
688
10S
Stanford
43.1
15.5
6.2
1.8
0.6
0.1
690
11E
Providence
40.6
18.1
6.2
1.8
0.5
0.1
729
10MW
Arizona St.
47.7
17.5
5.9
1.4
0.4
0.1
1015
9E
G. Washington
50
11.1
4
1.4
0.4
0
9 1062
8E
Memphis
50
11.1
4
1.4
0.4
0
9 1070
11W
Nebraska
41.1
13.7
5.2
1.4
0.3
0
9 1111
10W
BYU
40
14.5
5
1.3
0.3
0
8 1255
10E
Saint Joseph’s
36.8
10.8
4.4
1.2
0.3
0
8 1325
11S
Dayton
33.3
12.5
4.2
1.1
0.3
0
7 1494
9MW
Kansas St.
35.1
8.3
2.2
0.8
0.2
0
6 1704
6MW
Massachusetts
33
10.6
3.9
0.8
0.2
0
5 1834
12MW
Xavier
27.2
6.2
1.7
0.6
0.2
0
5 2169
12W
N. Dakota St.
36.7
14
2.7
0.8
0.2
0
4 2259
12S
S.F. Austin
27
9.5
2
0.6
0.1
0
3 3397
8S
Colorado
28.5
4.8
1.5
0.4
0.1
0
2 5169
13S
Tulsa
26.6
8.3
1.6
0.43
0.1
0
2 5361
13W
New Mexico St.
27.4
10.1
1.7
0.4
0
9 0.0
2 5845
14E
N.C. Central
26.8
8.6
2.1
0.4
0
9 0.0
1 6848
13MW
Manhattan
12.7
5.1
1.1
0.3
0
6 0.0
1 7639
12MW
N.C. State
15.7
2.8
0.6
0.2
0
4 0.0
08 12948
15W
American
17.8
5.1
1.1
0.2
0
2 0.0
04 26625
14MW
Mercer
15.4
3.8
0.9
0.1
0
2 0.0
03 35657
13E
Delaware
15.7
3.5
0.5
0.1
0
15 0.0
02 53891
14S
Western Mich.
16.4
3.6
0.7
0.09
0
1 0.0
01 67027
14W
La.-Lafayette
13
3.2
0.6
0.08
0
1 0.0
01 78951
15S
E. Kentucky
11.8
2.4
0.4
0.05
0
06 0.0
006 162840
15E
Milwaukee
7.7
1.2
0.2
0.02
0
01 <.0
001 992385
16W
Weber St.
4.2
0.5
0.07
0
8 0.0
006 <.0
001 2104239
15MW
Wofford
8.7
1.4
0.14
0
8 0.0
006 <.0
001 2248165
16MW
Cal Poly
3.3
0.4
0.04
0
4 0.0
003 <.0
001 4225592
16S
Albany
2.3
0.3
0.04
0
4 0.0
003 <.0
001 5124856
16S
Mt. St. Mary’s
2
0.2
0.03
0
2 0.0
002 <.0
001 8766968
16E
Coastal Car.
3.3
0.4
0.03
0
2 0.0
001 <.0
001 20811710
16MW
Texas Southern
1.3
0.1
0
6 0.00
04 <.0
001 <.0
001 106501028
Continue reading Kenpom.com 2014 NCAA Tournament log5 →
Home for news, information and opinion about Providence College basketball #pcbb